Industry Update
Strategy
How to Measure the Value of Your Instagram Campaigns
Aug 14, 2019
Strategy
Aug 14, 2019
Instagram has more than 1 billion active users, making it an incredibly powerful place to run marketing campaigns. But, if you’re not measuring your results, you won’t know what’s working. Here are the key metrics you need to keep an eye on and how to track them.
You know that Instagram is hot and you should be using it, but you’re not sure how to measure your results. If this sounds like you, you’re not alone.
Instagram has over 1 billion active users, making it one of the fastest-growing social media platforms ever and an incredibly powerful place to grow and nurture your audience. It’s a no-brainer that you should be marketing here, but that involves measuring what’s working and what’s not.
You see, tracking the results of your campaigns is vital if you want to grow your account and generate a highly-engaged following, but it can be tricky knowing what metrics are important.
Here are some of the top metrics you need to watch to understand the value of your Instagram campaigns:
More followers equals more brand credibility, right?
But there’s a more important and insightful metric that you should be keeping an eye on, and that’s your follower growth rate. This will show how well your campaigns are performing, or if they’re even performing at all.
This all-important metric lets you know whether your campaigns are expanding your business and catching the attention of new audiences. To boil it down, the fluctuation in your follower count is far more telling than the actual number of followers you have.
You divide the number of followers gained during your campaign by the amount of followers you had at the start.
Say, for example, your pre-campaign follower count was 500 and you landed 50 new followers while it was running. This gives you a growth rate of 10%, which is great. But, if your pre-campaign follower count was 5,000 and you got only 50 new followers, that’s a growth rate of only 1% – not so good.
This might indicate that your campaign wasn’t as compelling as you’d hoped.
Instagram doesn’t make it easy for you to link out to your website like other social media platforms do, but that doesn’t mean you can’t measure it at all.
In fact, your Insta account can be a powerful driver of traffic, even if you can only have a clickable link in your bio.
However, the advent of Instagram Stories and the ability to link out from those means there are now more ways than ever to get your Instagram followers to your website during a campaign.
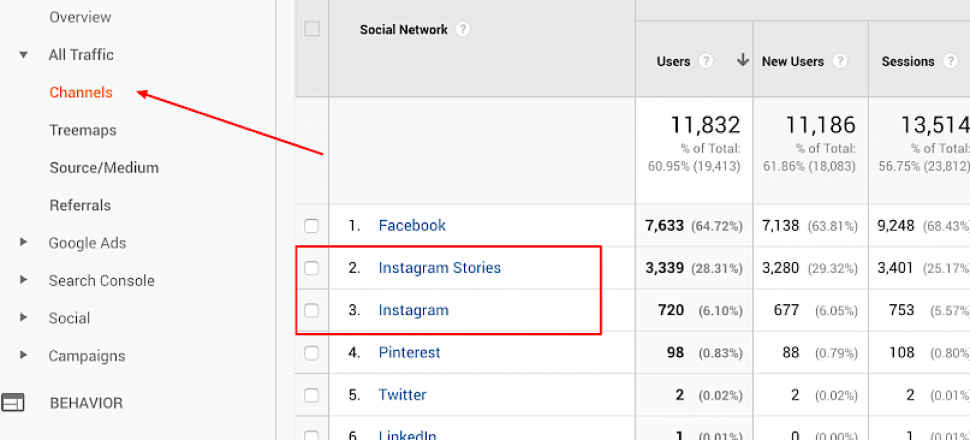
This is fairly easy to track using Google Analytics, which segments your traffic into default groups including “social”.

Once inside the tool, go to “Acquisition” and then “Channels”. Click “Social”, and you’ll be served a detailed breakdown of the platforms that have drive traffic to your site.
Keep your eyes peeled for Instagram and Instagram Stories (which are separate from each other in the listings).
You can take this one step further, too, and track “Goals” within Google Analytics to determine if the traffic you’re getting from your Instagram campaign is actually converting.
We’ve just gone over how you can track traffic coming from Instagram, but what about specific links and updates? Can you see what the activity is like on each of those?
You sure can.
In fact, you can create URLs with UTM codes that basically tell Google Analytics (or whichever analytics platform you’re using) what link a visitor clicked on to get to your site. You can type out a UTM URL manually, but there are plenty of tools that will generate them for you and also provide you with metrics.
Try GA Campaign Builder to start with, which is free and popular.
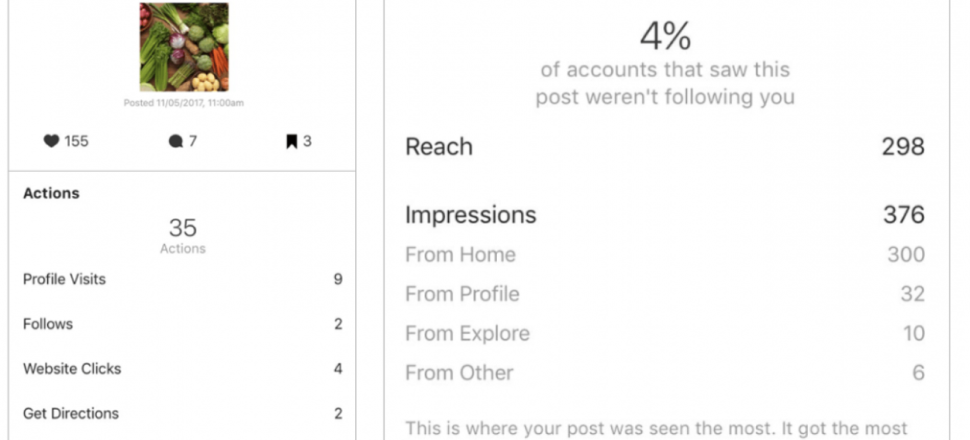
If you think that reach and impressions are practically the same things, you’re not alone. But this isn’t exactly true.
Sure, they’re similar, but whereas impressions calculate the number of people that might have seen your content, reach shares the exact number of people who have actually seen it.
Say, for example, the same person sees your content three times.
That will count as three impressions, but it will only count as one in terms of reach. This makes it a powerful metric for discerning how many people are actually seeing your campaigns rather than the number of times it’s been seen.

Along with your total reach, you can also track what’s called your “reach rate”, which is essentially the percentage of your followers that actually see your post.
This is calculated by dividing the total reach of one of your campaign posts by the number of followers you have. For example, if you have a reach of 600 on one post and 10,000 followers, you reach rate is 0.06%.
Instagram Stories allow for serious engagement and to show your followers the less serious, more raw side of your brand.
These Stories – which can come in the form of a video, a photo, or a GIF-inspired animation – disappear after 24 hours, which makes them a little trickier than usual to measure. But that shouldn’t stop you.
There isn’t anywhere you can track your Stories engagement outside of Instagram but, if you have a business account on the platform, you can use the in-built Insights to determine how successful your Stories campaigns are.
There are two metrics you can measure here: reach and exits.
Reach relates to how many individual people watched your story, while the exit count shows you where people were in your story when they navigated away.
This can be a good indicator of a particularly non-engaging story, meaning you can shake things up a bit in your next campaign.
Instagram is a powerful social media platform with billions of potential users you can reach. But, if you’re not measuring the success of your campaigns there, how will you know whether they’re performing well or not?
The answer is, you won’t.
However, with these key metrics, you’ll be able to quickly determine what’s performing well and what isn’t, meaning you can inject more of the good stuff into your future campaigns!