Product
Informative
Exploring the Benefits of Google Trends
May 22, 2018
Informative
May 22, 2018
Do you know someone who has never used Google? Me neither. Google has become part of people’s daily lives as nearly everyone uses it to some capacity, some more or less than others. It is the world’s leading and most popular search engine, with more than 1.5 billion users worldwide. In fact, Google processes an average of around 40,000 search queries per second! This proves that Google really has become ingrained in people’s daily, online lifestyles, becoming the hub that people refer to if they have a question or query about a certain topic. However, just as interesting, is Google’s data collection of search query informations, allowing users to view some highly useful and interesting data which can be used for marketing and research purposes. If you haven’t yet, say hello to Google Trends.
So now that you have an idea of what Google Trends is about, let’s dive in a bit deeper.
Google Trends is an online tool that helps users visualise and discover trends in people’s search behaviour within Google Search, Google News, Google Images, Google Shopping and YouTube. It is an extremely useful tool when it comes to reviewing the success of a company’s SEO strategy. It will not only allow users to see what topics and queries have been popular in searches but will also give access to data containing how often specific searches have been made over a certain period of time, that you can specify in the filters. The data can then be visualised by Google, producing a trend graph of the searched topic over the selected amount of time, allowing you to efficiently analyse the results. The Search Volume Index graph can be used to visualise the queries of up to 5 different searches at the same time, enabling you to conduct analyses and comparative research.
Before we begin, click here to check out the Google Trends page.
Let’s start by simply entering a topic or query into the search bar. After entering your desired topic, you will be presented with these four refinement options, which will allow you to further scrutinise and fully explore the results. These are:
When analysing the Search Volume Index in Google Trends, there are a few important things you should keep in mind. The graph that appears after you have looked up a certain topic or query does NOT represent the actual search volume numbers, but rather an index ranging from 0-100. The numbers represent the search interest relative to the highest point on the chart for the selected region and time. A value of 100 is the peak popularity of the term, whilst a value of 50 means that the term is half as popular. Scores of 0 mean that a sufficient amount of data was not available for the selected term.
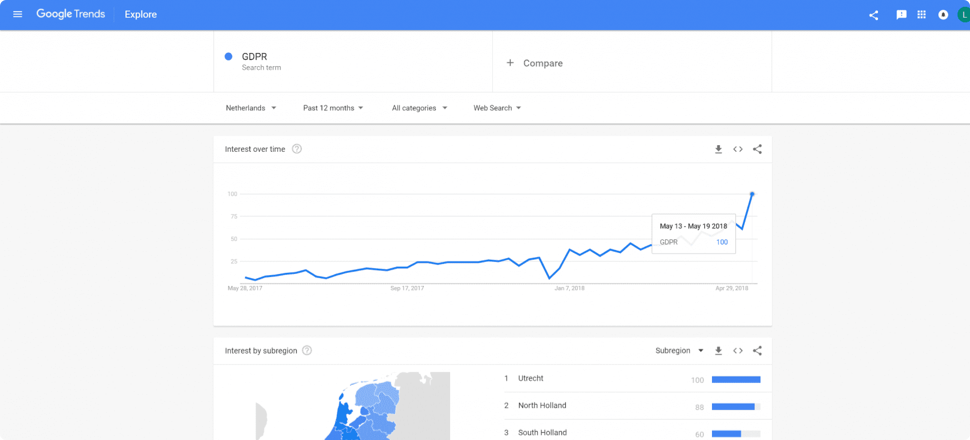
Let’s use the image below as an example.

As you can see, we looked up ‘GDPR’ to find out how often this has been queried in the last 12 months. The search focused specifically on the Netherlands and on all Google Web Searches. As expected, the search popularity peaked towards the end of April until today in May, due to the recent data scandal and the new GDPR rules that are following. It’s also interesting to note the rise of searches surrounding this topic since May last year.
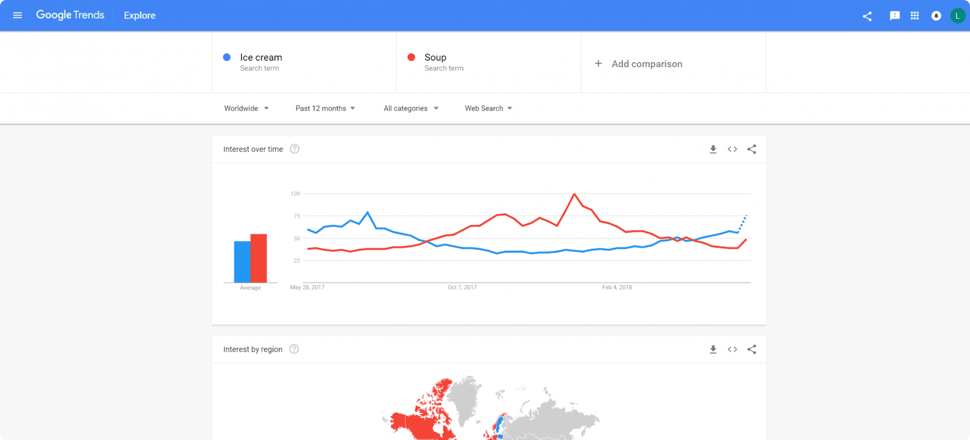
In order to visualise a comparative research example, I’ve decided to compare something people love eating in the winter to a snack people usually enjoy most in the summer: soup vs ice cream.

The results prove that the stereotype is true! People tend to more frequently look up ice cream recipes, brands, pictures etc. in the summer, with the graph decreasing as the summer comes to a close. Whilst, on the contrary, Google queries and searches for soup information decreased in the summer, before increasing significantly in the autumn and winter periods.
Endless amounts of fun and interesting comparisons can further be made using Google Trends!
Google Trends has become an important tool for many businesses around the world. Let’s go through some of the benefits and opportunities that Google Trends offers to advertisers and marketers.
Google Trends’ homepage contains a range of different, trending information from various countries. Including amongst this information is featured insights at the top of the page, and trending stories under it. This information can be particularly useful as such hot topics can be used by advertisers in order to create content and shape up strategies.
There are several ways in which businesses can monitor and measure their marketing and brand performances. One of which being the Google Trends tool, as it can help you discover how much activity or interest is being shown towards your product or brand.
The Search Volume Index can also help you discover in what periods your brand or ‘keyword’ is most often looked up, allowing you to view the popularity peaks, and the times in which people do not interact as much with your product or brand.
Results can at times be a little confusing as your brand’s name may also be used for other kinds of research. Therefore, it is worth exploring the results that arise when you type in your brand’s name + a product or service, before discovering and measure its popularity.
As has already been mentioned before, it’s possible to see what countries or regions have a strong interest towards the keyword you have researched. This invaluable information can help you set up effective ad campaigns, whilst helping you target the right audiences. Whereas a certain topic might not be popular at all in one country, it could be heavily trending in the next.
In order to increase traffic to your website, a solid SEO strategy is needed. With the help of Google Trends, it’s easier to find out what particular words are queried on a frequent basis, whilst you can test out keywords and measure their potential success, should you decide to, for example, include the said keyword in your new article or blog title.
Another way that this tool can be used is to analyse your competitors’ performances. Although it is not the deepest form of competitor analyses available, it will still give you a good picture of how often their product, brand or service is being looked up on Google’s search engines.
So as you can probably tell, there’s plenty you can do with Google Trends! We really love using this awesome tool! What’s your favourite thing about it? Have you tried it out yet? If not, give it a try by clicking here!